


The overall conclusion is that the 29-year variation is to do with the work involving the linear fitting but there is a general variation of about 18 years in all the tidal graphs which shows up in the full satellite data.
An Investigation using Tidal Gauge Data
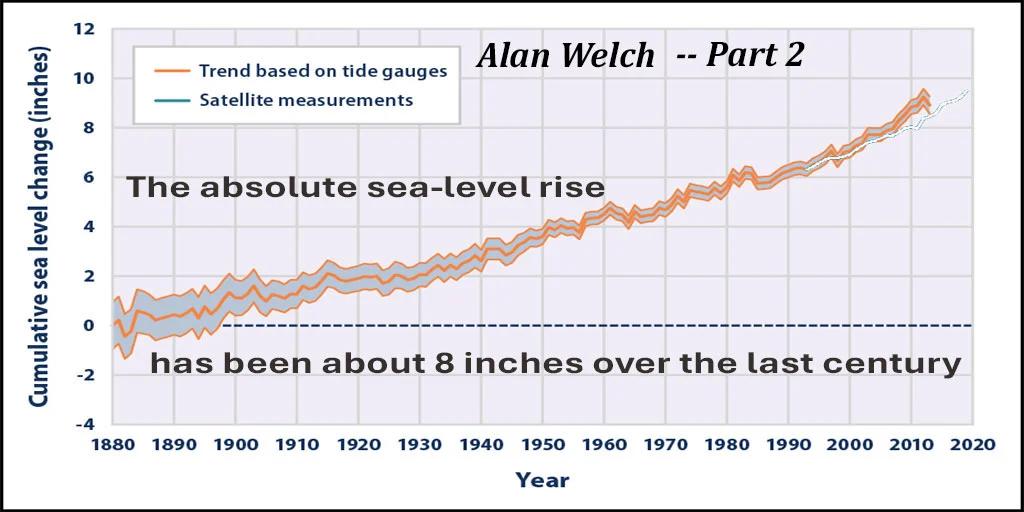
Part 2 – Curve Fitting
By Dr. Alan Welch FBIS FRAS – – November 2025
Note: This is Part 2 of a series — you might want to read Part 1 first if you haven’t already done so.
Curve Fitting
The individual Tidal Gau… [16321 chars]
Source: Watts Up With That | Published: 2025-12-03T22:00:00Z
Credit: Watts Up With That